
Home Care Agency Profit Margins: What's Typical and What Moves Them
Gross vs. net margin for non-medical home care, a worked hour at the 2025 median rate and wage, and the five levers that move profit most.
By Caregiver Scheduling Team ·
A private-pay non-medical home care agency typically keeps 35% to 45% of each billed hour after caregiver wages and payroll costs, and single digits to the mid-teens after office staff, rent, insurance, marketing and software. Those ranges are illustrative, built from the 2025 national median bill rate and caregiver wage below, not from an audited survey. Medicaid-heavy agencies run thinner because the state sets the rate.
What is the difference between gross and net margin?
Gross margin is what is left after the caregiver is paid. Net margin is what is left after everything is paid.
| Term | Formula | Illustrative range, private pay |
|---|---|---|
| Gross margin | (Revenue minus caregiver wages minus payroll burden) divided by revenue | 35% to 45% |
| Net margin | (Revenue minus all costs) divided by revenue | Single digits to mid-teens |
Gross margin tells you whether your bill rate is right. Net margin tells you whether the business is working. See calculating a bill rate and the break-even guide.
What does a typical billed hour look like in 2025?
About $35 in, about $20.65 to the caregiver and payroll taxes, and about $14 left for everything else. CareScout’s 2025 Cost of Care survey puts the national median rate for a non-medical caregiver at $35 per hour, up 3% from 2024. BLS reports the May 2025 median wage for home health and personal care aides at $17.21 per hour, with the 25th percentile at $15.35 and the 75th at $18.98.
| Line | Per hour | Share of revenue |
|---|---|---|
| Bill rate (CareScout 2025 national median) | $35.00 | 100% |
| Caregiver wage (BLS May 2025 median) | $17.21 | 49.2% |
| Payroll burden at 20% (illustrative: FICA, FUTA, state UI, workers’ comp) | $3.44 | 9.8% |
| Gross margin | $14.35 | 41.0% |
| Overhead at 28% of revenue (illustrative) | $9.80 | 28.0% |
| Net margin | $4.55 | 13.0% |
Your burden depends on your state’s unemployment and workers’ comp rates. See caregiver payroll burden. Your overhead share depends on how many billed hours each coordinator supports. Local rates vary widely, so check yours in the hourly rate tool and home care rates by state.
What moves margin the most?
Bill rate first, then wages, then the hours you pay for but cannot bill.
1. Bill rate. Every $1 on a $35 rate adds about 2.9 points of margin, all of it profit. Most agencies underprice because they compare to competitors rather than to their own costs. See how much to charge.
2. Caregiver wage. A $1 raise with 20% burden costs $1.20, or 3.4 points of margin at $35. But paying below market raises turnover, which costs more than the raise. See the cost of caregiver turnover.
3. Payroll burden. Workers’ comp and state unemployment rates vary by state and by your claims history. Turnover pushes both up, because unemployment wage bases restart with every new hire.
4. Paid non-billable time. Travel between clients, paid training and overtime premiums. A caregiver paid for 45 minutes of driving a day at $17.21 costs about $65 a week with nothing to bill against it.
5. Overhead per billed hour. Office costs are mostly fixed, so margin grows as billed hours grow, until you need the next coordinator.
Where does margin leak?
In the gap between hours worked and hours billed, and in hours paid at a premium.
- Overtime from last-minute coverage. Time and a half on $17.21 is $25.82, which erases most of the gross margin on that hour. See overtime rules.
- Unbilled time: visits that ran long, or hours past a Medicaid authorization.
- Short visits without a minimum, where travel eats the margin.
- Late invoices and unpaid private-pay balances.
- Payroll errors from copying hours by hand, which cost twice: the correction and the trust.
How do margins differ by payer?
| Payer | Who sets the rate | Margin pressure |
|---|---|---|
| Private pay | You | Lowest |
| Long-term care insurance | You; the client is reimbursed | Low |
| VA | VA fee schedule or contract | Medium |
| Medicaid waiver or managed care | State or plan | Highest |
Medicaid rates in many states sit well below the $35 private-pay median, and the program adds EVV, authorization tracking and claim denials to your overhead. See private pay vs. Medicaid.
What is a good profit margin for a home care agency?
A net margin of 10% or more is healthy for a private-pay agency, and gross margin should sit at 35% or better. Below 30% gross, no amount of overhead discipline will save the year. Treat those thresholds as planning targets rather than survey results.
How Caregiver Scheduling handles this
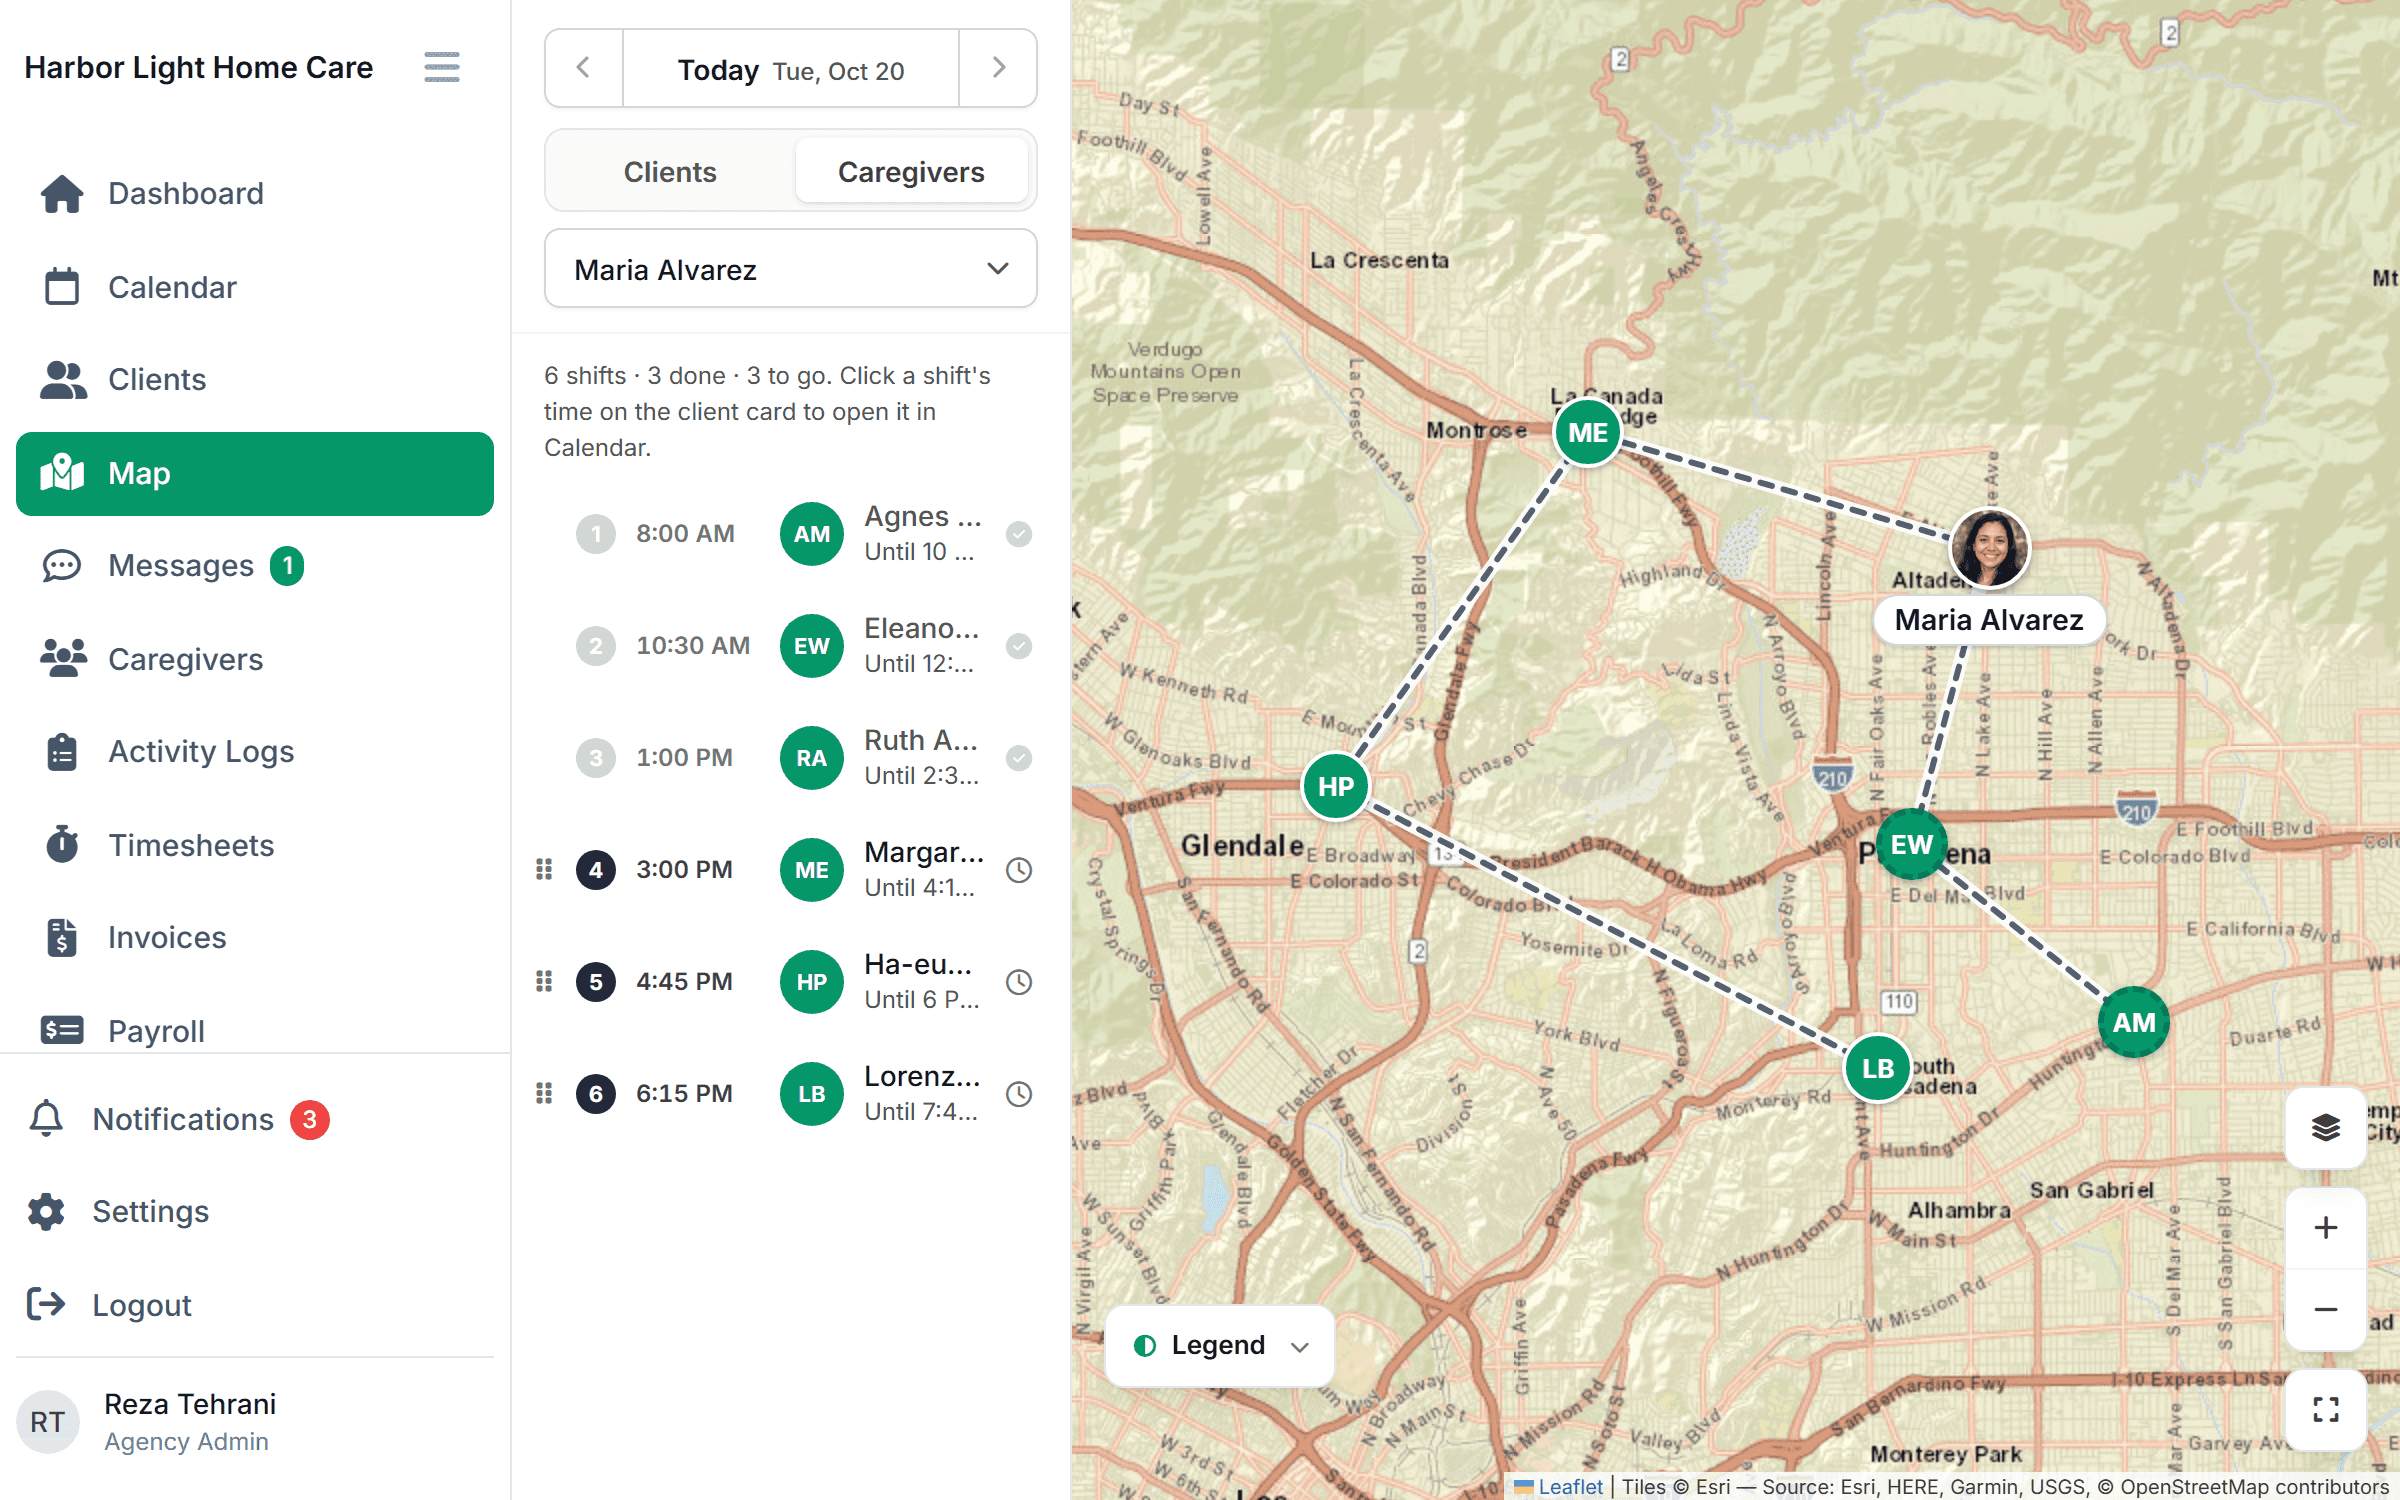
Route optimization cuts the drive time you pay for, and on Growth and up authorization caps stop unbillable Medicaid hours. Invoices built from the same verified check-ins as payroll, so a long visit is billed instead of lost, are coming soon. $199/month for up to 10 caregivers or $299/month for up to 50, free for 30 days.
FAQ
What is a good profit margin for home care? A net margin around 10% or more, with gross margin at 35% or better, is healthy for a private-pay agency.
Why are Medicaid margins lower? The state or plan sets the rate, often well below the private-pay median, and EVV and authorizations add work.
How can I improve margin quickly? Check your bill rate against your real costs, add a visit minimum, and cut overtime by scheduling backups ahead of time.
How much does $1 on the bill rate matter? At a $35 rate, each dollar adds about 2.9 points of margin, and all of it is profit.
This article is general information, not financial or legal advice. Run your own numbers and check your state’s rules.